Disclosure: we make ThumbnailPeak, a set of tools for testing thumbnails before you publish. What this post says about YouTube's test comes from YouTube's help pages, read on 21 October 2026. The worked example uses made-up numbers, and says so.
When you run YouTube's A/B test on a video (first called Test & Compare, now A/B Testing in YouTube Studio), you might expect the winner to be the thumbnail people clicked most. It isn't. YouTube's help page says:
To help your video get high quality engagement, we optimize tests for overall watch time over other metrics, like click-through-rate.
So the test can keep a thumbnail with a lower click-through rate, and people are sometimes surprised when it does. It isn't a mistake. It's the test doing what it was built for.
What "watch time share" means
YouTube shows every option at the same time, each to its own share of the people who would have seen the video. When the test ends, it reports each option's watch time share: how much of the watching that came from the test came from that option. The option with a clearly bigger share is the Winner. If the shares are close, the result is Performed Same or Inconclusive, and the first option you uploaded stays on the video.
YouTube doesn't publish the exact formula. But the idea is simple. A click only helps an option if the person goes on to watch. A thumbnail that gets lots of clicks from people who leave after ten seconds earns less watch time than one that gets fewer clicks from people who stay.
A worked example (made-up numbers)
Say a test shows two thumbnails, each about 10,000 times.
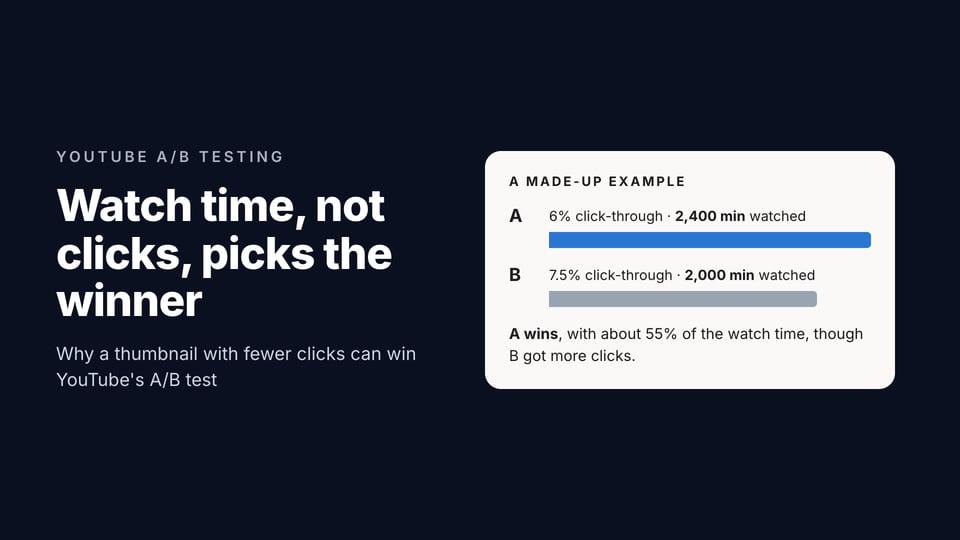
- Thumbnail A gets a 6% click-through rate: 600 views. People who click watch 4 minutes on average. That's 2,400 minutes of watch time.
- Thumbnail B gets a 7.5% click-through rate: 750 views. But it promises something the video takes a long time to get to, and people who click watch 2 minutes 40 seconds on average. That's 2,000 minutes.
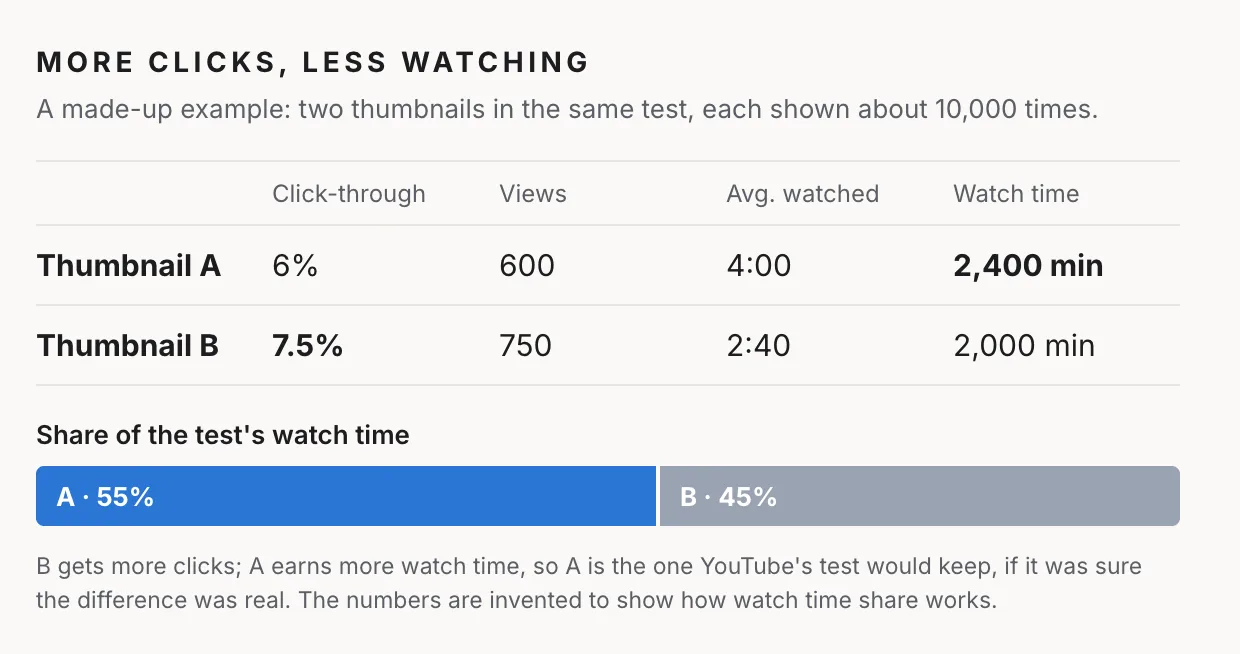
B wins on clicks. A wins on watch time, with about 55% of the total against B's 45%. YouTube would keep A, if it was sure the difference was real.
The numbers are invented, but the pattern is the one YouTube describes on its click-through rate page: a thumbnail with a high CTR, a low average view duration and fewer impressions than expected is, in its words, clickbait.
Why YouTube does it this way
YouTube gives the reason in its own help page: titles and thumbnails "help a viewer understand what the video is about so that they don't waste their time clicking on the wrong videos." A thumbnail that wins the click and loses the viewer is bad for the viewer, and it's bad for the video too. YouTube says it recommends a video when "the video's average view duration indicates that viewers find it interesting", so clickbait tends to get recommended less.
Judging the test on watch time means the test can't be won by a thumbnail that tricks people into clicking.
It's also why YouTube's results can disagree with other testing tools. YouTube's help page says many of them swap thumbnails one after another and often optimise only for click-through rate, which "may determine a different 'winner' than measuring by watch time share."
What it means for your thumbnails
The thumbnail has to promise what the video delivers. The fastest way to lose a watch-time test is a thumbnail that shows something the video doesn't, or doesn't get to for ten minutes. If the best moment is at the end, the thumbnail can tease it, but the video has to make people believe it's coming.
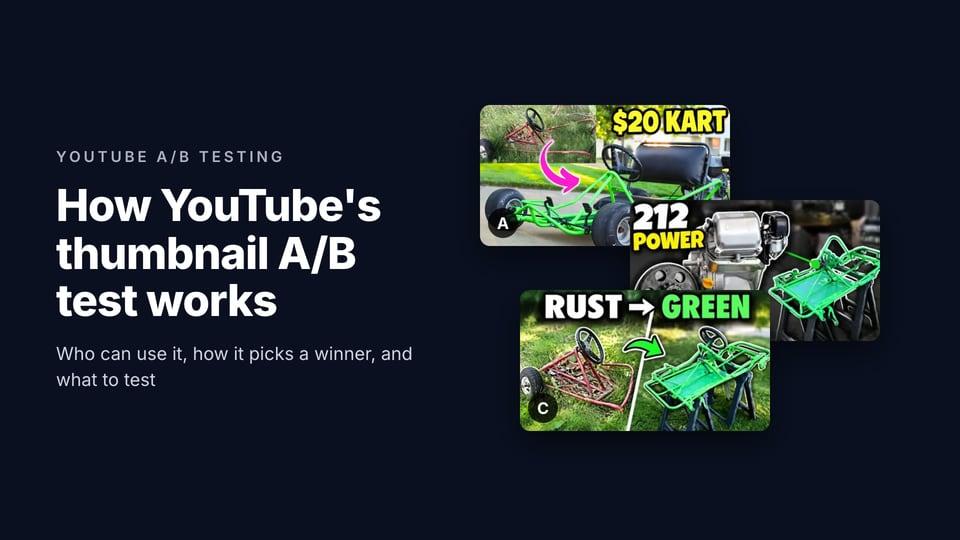
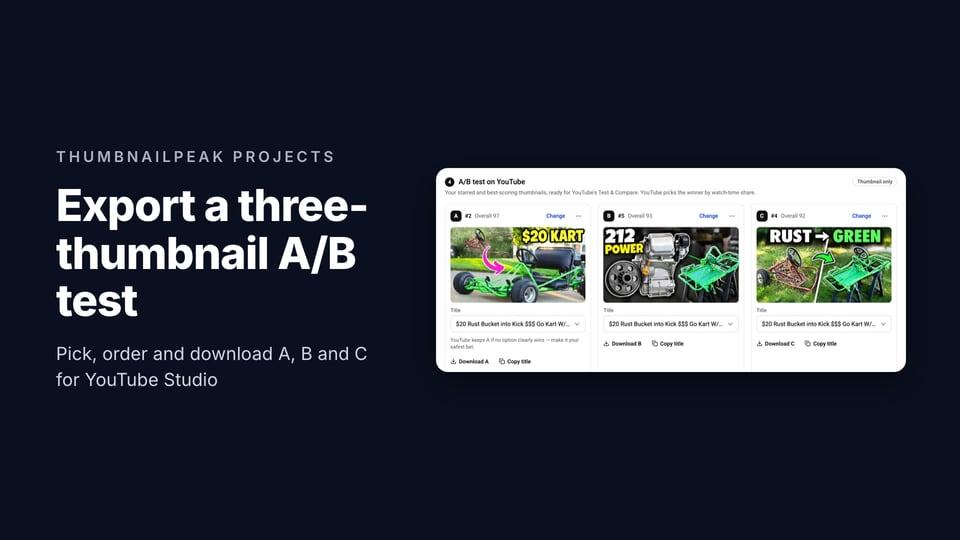
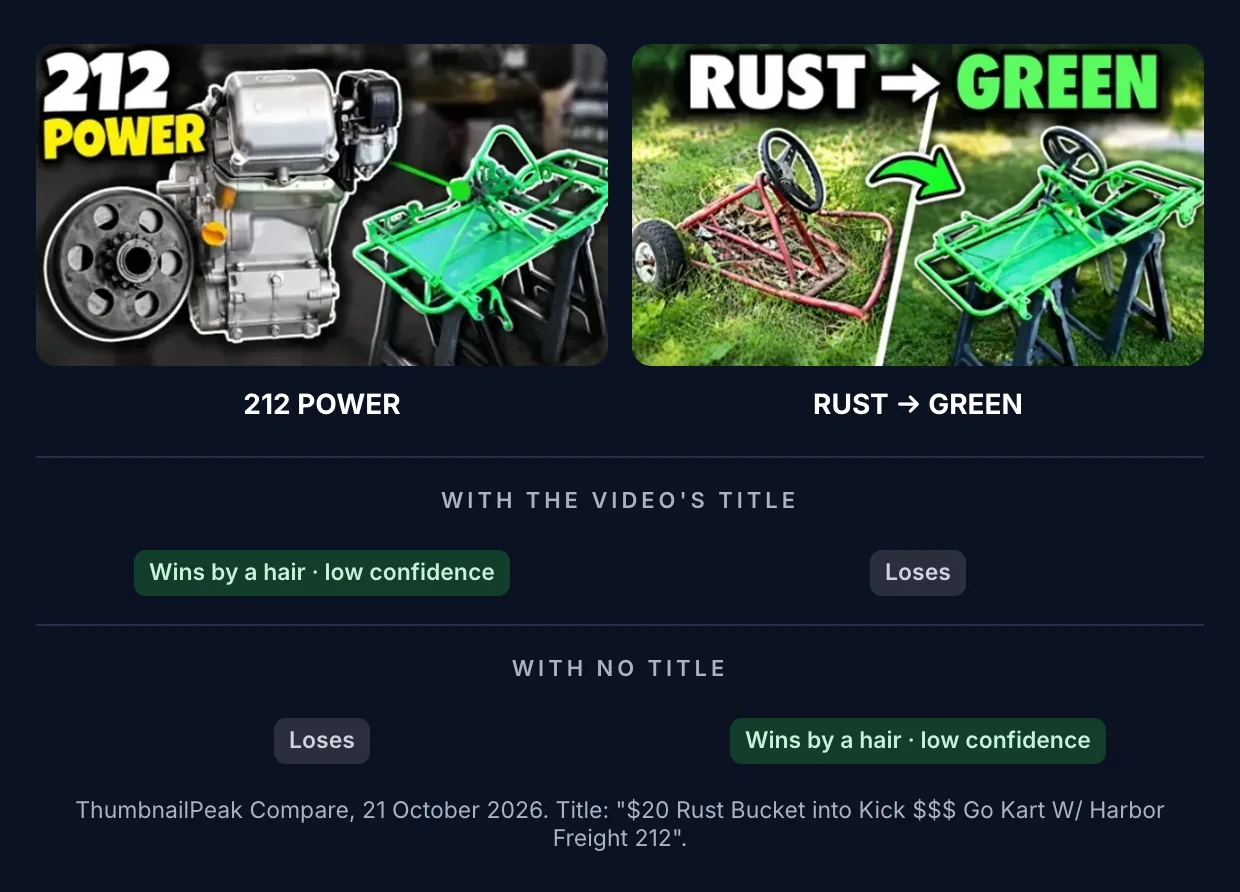
The title and the thumbnail are judged together. Viewers see both at once, and they decide what the video is about from the pair. We saw how much the title changes a close call with our own example, a go-kart build by DIY PRO titled "$20 Rust Bucket into Kick $$$ Go Kart W/ Harbor Freight 212". We asked ThumbnailPeak's Compare to judge two concepts for it: "212 POWER", which shows the engine, and "RUST → GREEN", which shows the frame before and after. With the title, "212 POWER" won by a hair, because it "clearly shows the Harbor Freight 212 engine" the title names. Without the title, "RUST → GREEN" won by a hair instead. Neither was a clear winner either way. But the title decided which way the coin fell.
A lower-CTR winner is not a reason to overrule the test. You can always change the thumbnail by hand after a test. But if YouTube kept the option with fewer clicks, it's because more watching came from it. Switching to the higher-CTR option brings back the version that lost.
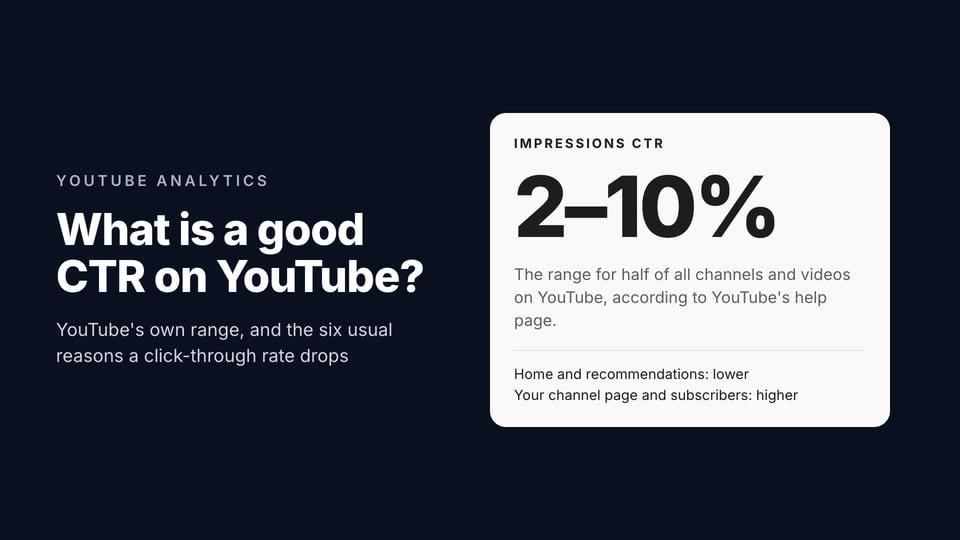
Click-through rate on its own is a poor way to compare thumbnails. It changes with where the impressions came from and how many there were, as we explain in what a good CTR on YouTube is. YouTube's test avoids most of that by showing every option at the same time, to the same kinds of viewers.
What ThumbnailPeak can and can't tell you here
No tool outside YouTube can measure watch time before you publish, ours included. What ThumbnailPeak's AI critique does, when you give it your title, is grade the fit between the thumbnail and the title on three checks:
- Topic match: does the picture show what the title is about?
- Promise consistency: does the thumbnail promise what the title promises?
- Title complementarity: does it add to the title, or repeat it?
Most of the differences in the go-kart comparisons showed up in those checks. When we added the price to DIY PRO's own thumbnail as two words, "$20 KART", Compare picked the new version clearly, and the grades that went up were curiosity, promise consistency and title complementarity. The picture now said what the title said.
That isn't a watch-time prediction. It's a check that the thumbnail is telling the same story as the title, which is what a watch-time test rewards. For how the test works from start to finish, see our guide to YouTube thumbnail A/B testing.
Frequently asked questions
What is watch time share in a YouTube A/B test?
It's the share of the test's total watch time that came from each option. If two options earned 2,400 and 2,000 minutes, their shares are about 55% and 45%. YouTube names a winner only when one option's share is clearly bigger and it's sure the difference is real.
Can a thumbnail with a lower click-through rate win?
Yes. If the people who click it watch for longer, it can earn more watch time from fewer clicks, and YouTube will keep it.
Does CTR still matter?
Yes. A view has to start with a click, so a thumbnail nobody clicks earns no watch time. But YouTube's test only rewards clicks that turn into watching.
Can I keep the option with the higher CTR instead?
Yes. After the test, you can set any thumbnail or title by hand. Just know that the test found the other one earned more watch time.
Why did my A/B test end as "Performed Same"?
The options earned about the same watch time. YouTube says that's common, and usually means the options weren't different enough to change how people watched.
Sources, read on 21 October 2026: YouTube Help, A/B test titles & thumbnails and Impressions & click-through-rate FAQs. The worked example's numbers are made up. The go-kart comparisons were run on ThumbnailPeak on 21 October 2026. The video is "$20 Rust Bucket into Kick $$$ Go Kart W/ Harbor Freight 212" by DIY PRO, published under CC BY 3.0; the thumbnails shown are our adaptations of its frames and thumbnail, and DIY PRO did not make or endorse them.